HISTORICAL VIRTUAL BUOY REPORTS
Buoyweather provides over fifteen years of historical Virtual Buoy reports spanning from 1997 to yesterday on the website with a premium subscription. Roughly 2.5 days of data is provided per page view. If you are in need of historical data in bulk, please see our Historical Data Page for details or contact us at consulting@buoyweather.com.
Three data formats are available on the website including the familiar wind/wave graph plus the offshore and nearshore text products. These are commonly used for investigating marine related accidents or damage, planning vacations to choose the ideal time of year, or comparing current forecasts with previous events to refine the outlooks. Our historical wind/wave graph format is unique in that you can plug in dates of the past and below the past data is a graph of the current forecast at the same location for comparison. The times listed are in UTC. They are not adjusted to your local time zone. This is a unique system only provided to Buoyweather subscribers allowing easy to use access to dynamic historical ocean hindcasts anywhere on the ocean.Choosing Hindcast Points
The source of the data is the Global WaveWatch III model which is on a fixed grid where latitudes are spaced at 1.0 degrees and longitudes at 1.25 degrees. The Virtual Buoy point you choose below must be a valid grid point. With our regional models and the latest global model being .5 degree, the historical point may not match up exactly with the Virtual Buoys. We have a map tool to help you find the nearest hindcast point. The latitude needs to be rounded to the full degree. Longitudes are on the 1.25 interval starting at 0 so the point must be evenly divisible by 1.25 to be on the grid.
It is important to understand model data when choosing and analyzing points. Here are some key items to consider:- Inland seas are not covered by the historical data on the website. Examples: Mediterranean, Red Sea, Caspian etc. However, inland seas are covered by our bulk historical data, described here.
- Points must be on the model grid and over water. Points on or too close to land will not have wave data.
- The model provided here is most valid for deep water, offshore points. Shallow water, local points, small islands, or any topography altering winds/waves may not be fully resolved by the data provided here. This model provides outlying conditions only.
- Tropical Cyclones may not be fully resolved depending on the event, so the full effects of tropical storms, hurricanes, and typhoons may not be apparent. Global scale models often lack the resolution to fully estimate winds around tropical systems.
Below is a sample that shows the grid. Valid points are in the shaded area where the latitude and longitude grid lines cross. There is no wave data in the white areas.
A few valid sample points are circled below.
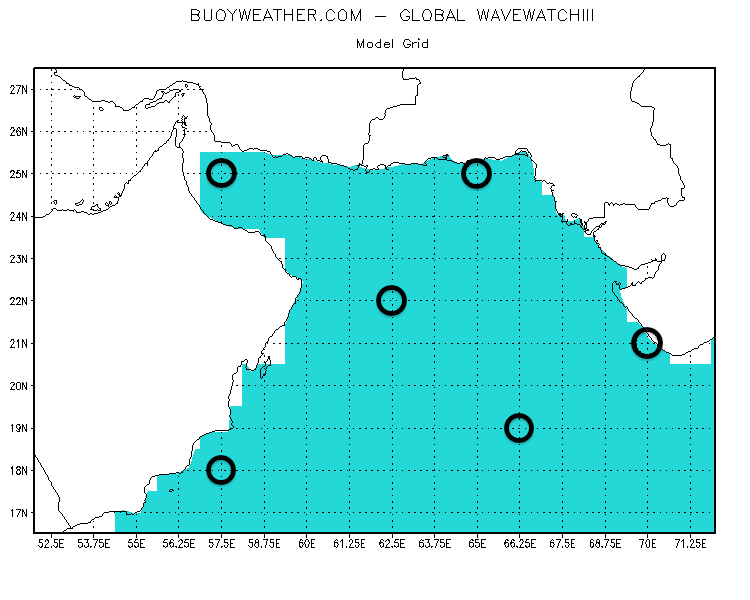
The available points in your area are where the lat/long lines cross.
Examples:
Latitude 30 degrees south = -30
Longitude 156 degrees 30 minutes west = -156.5 Use the form below if you would like to change the location of this page.